![]() Revision 3 November 30, 2005
Revision 3 November 30, 2005
![]()
The effect of an 80 meter band pass filter on signals from a K9AY loop.
On November 27, 2005 I ran a series of experiments using a HP141T-HP8553B spectrum analyzer to examine the received signals from a K9AY loop. The orientation of the loop and the terminating resistance play no part in this experiment.
The runs were made a 14:00 Mountain Standard Time (the time stamps on Figures 1-5 are in error) -- essentially the middle of the day. The frequencies examined were 0.5 to 5.5 MHz. The experimental setup involve running the K9AY loop output either directly into the spectrum analyzer or through either an 80 meter band pass filter or a broadband ARR preamplifier or both. The figures following show the direct input, the input with the band pass filter in line, the input with the preamp in line and the input with the filter followed by the preamp in line.
The midpoint of the display screen is - 80 dBm. The scan width is 0.5 MHz per division. The scan was done using a 1 KHz bandwidth. To capture the result I used the storage feature of the scope display and used a sweep time of 1 second. To reduce spurious products in the first mixer of the spectrum analyzer I used the 20 dB attenuation of the analyzer input. That level may still have been insufficient to prevent some
spurs. See Figure 2 below.
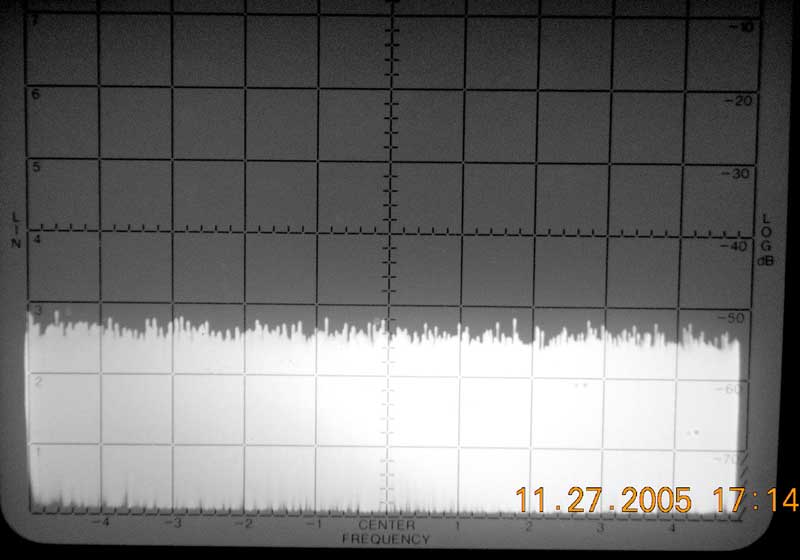
Figure 1
showing the system noise of the spectrum analyzer for the settings used. The -50 dB line (right hand scale) is -90 dBm so the noise is about -95 dBm. The next figure shows the signals from the K9AY.
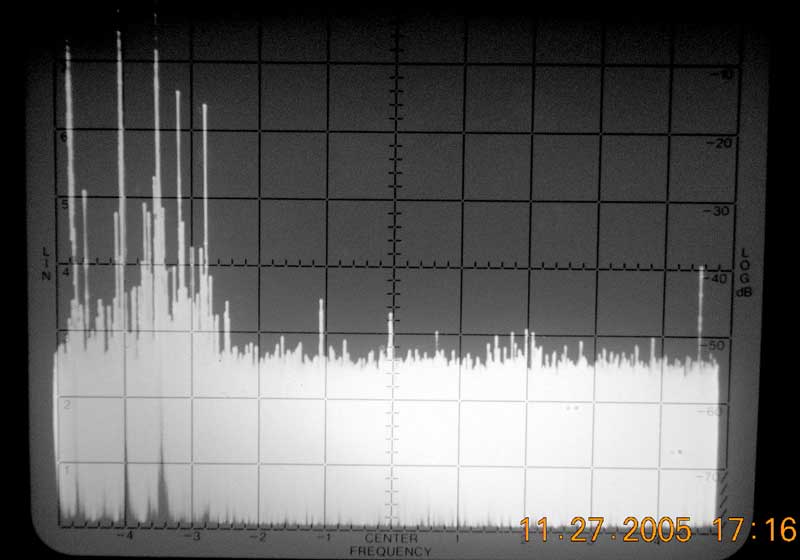
Figure 2
which show the un-amplified signals from the K9AY loop. The noise floor is still about -95 dB where there are no signals or spurious signals. The left hand side of the display shows the very strong Broadcast band signals and also the harmonics of some of those signals. It may be that 20 dB of attenuation is insufficient to eliminate internal spurs from the analyzer.
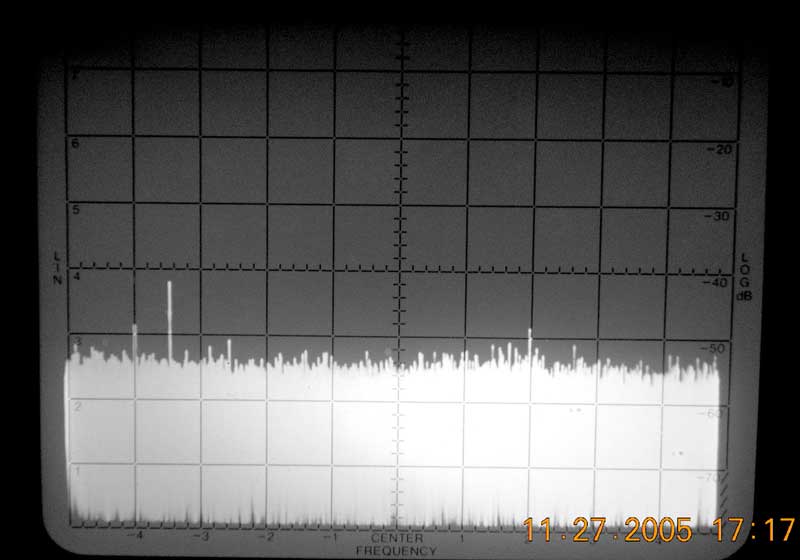
Figure 3
which shows the signals from the K9AY loop with a very high performance band pass filter inserted in line. The pass band of this filter is essentially the same as the 80 meter W3NQN filter.
The Broadcast band signals are essentially gone. The signals between 1 and 2 divisions to the right of the center line are the signals in the 3500-4000 kHz band. There are a few signals that are above the noise floor.
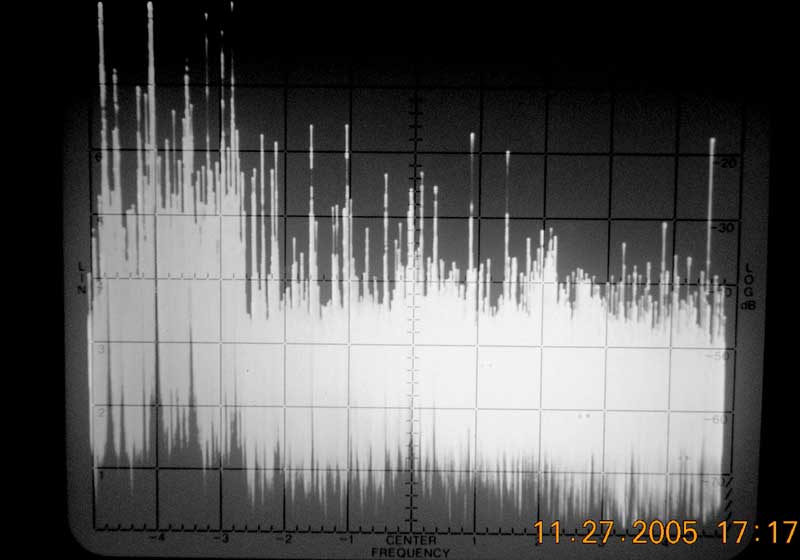
Figure 4
which show the signals from the K9AY loop after they have been amplified by the ARR preamplifier.
The Broadcast band signals have been increased dramatically from their strength in Figure 2 -- the raw input from the K9AY loop. As a result we see significant spurs generated in the mixers of the spectrum analyzer.
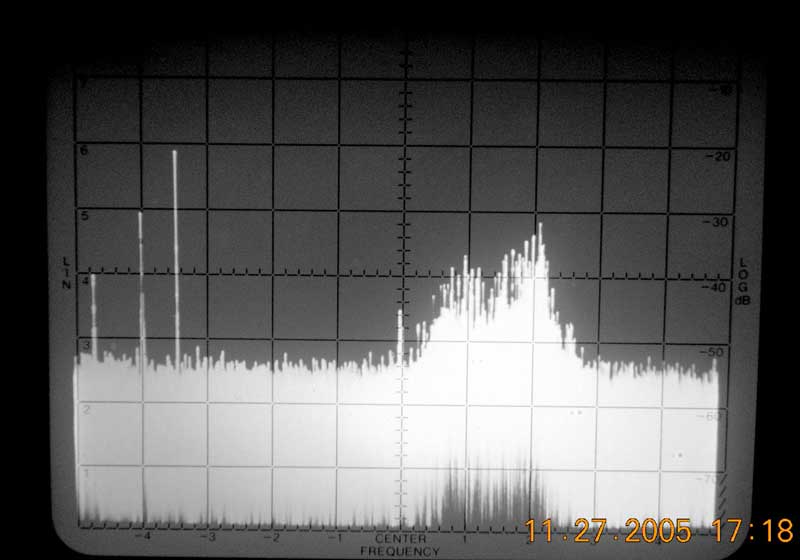
Figure 5
which shows the signals from the K9AY loop after they have gone through the 80 meter band pass filter and then the ARR preamplifier. The signal to noise improvement in the 3500-4000 kHz band is quite apparent. The noise floor is the same as the noise floor of Figure 1 which showed the noise level of the spectrum analyzer itself.
The gain of the preamp is about 18 dB and the signals in the band of interest have been pushed up so their signal to noise ratio is about 18 dB better than with just the 80 meter filter alone.
The three signals to the left of the display are the major BC stations close by - 600, 980 and 1260 kHz. I don't know if the signal at 2.95 MHz (just to the left of the center line) is real or a momentary signal pulse. The noise floor shown is -95 dBm which is essentially the noise floor of the spectrum analyzer with these settings.
If we had run the K9AY loop into a receiver after simply amplifying the signal ( the case in Figure 4) we might well expect to have spurious responses generated by the receiver mixers. By inserting a band pass filter in front of the preamplifier we can reduce those spurious signals and improve the signal to noise ratio dramatically. The filter should be one that reduces the BC signals as much as possible. One that has sharp, deep skirts close to the band of interest is desirable. Since this filter needs only to be able to stand the stress of strong local signals (such as when one transmits) the component cost will be significantly less than for a filter that must withstand 200 watts of transmitted signal . The W3NQN filters originally designed for transmitting can be fabricated with smaller cores and lower voltage and current capacitors and inserted in the line ahead of the preamp. See the W3NQN QST and QEX articles below. The 1998 article describes the design for TX & RX filters; the 1999 article describes RX filters with good adjacent band rejection. Both articles describe in detail how to fabricate the filters. WX0B offers the W3NQN transmitting filters ( http://www.arraysolutions.com/prod_category.htm ) but I am not aware of anyone having the W3NQN receiving filters for sale.
![]()
![]()
Many filters commercially available as transmitting filters for 160 and 80 do not have a great deal of rejection below the band of interest. This is particularly true of the 160 meter filters. The bottom of 160 (1800 kHz) and the top of the BC band (1700 kHz) are quite close in frequency and it requires special design to really drop the BC signals by 40 or 50 dB to get best results.
I am experimenting with fabricating such RX filters and when I have the work completed will post it on this site.
------------ Revision 3 material -------------
In response to a number of queries I have added the information and pictures below which show the filter I used and its characteristics in more detail.
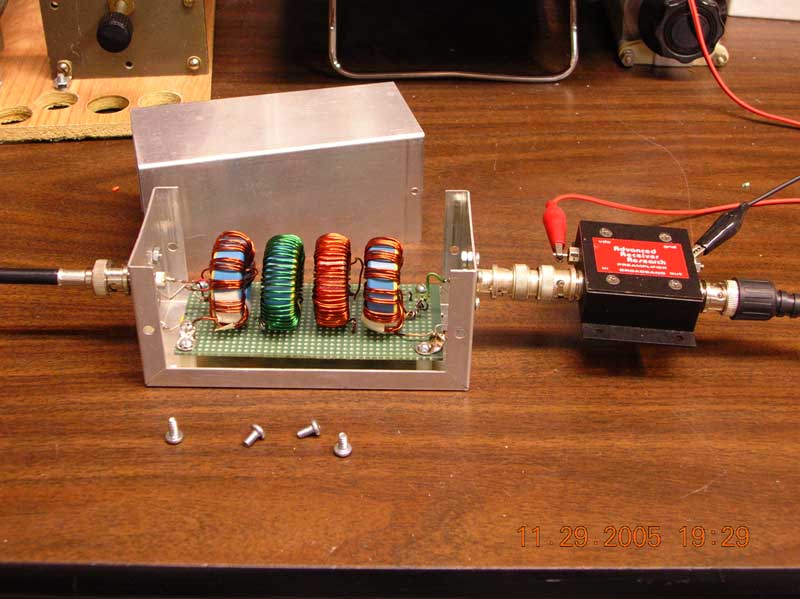
Figure 6
This figure shows the experimental setup with the filter cover removed. The signal enters at the left, goes through the filter then goes to the ARR 0.1-30 MHz preamp and the output of the preamp goes to the spectrum analyzer.
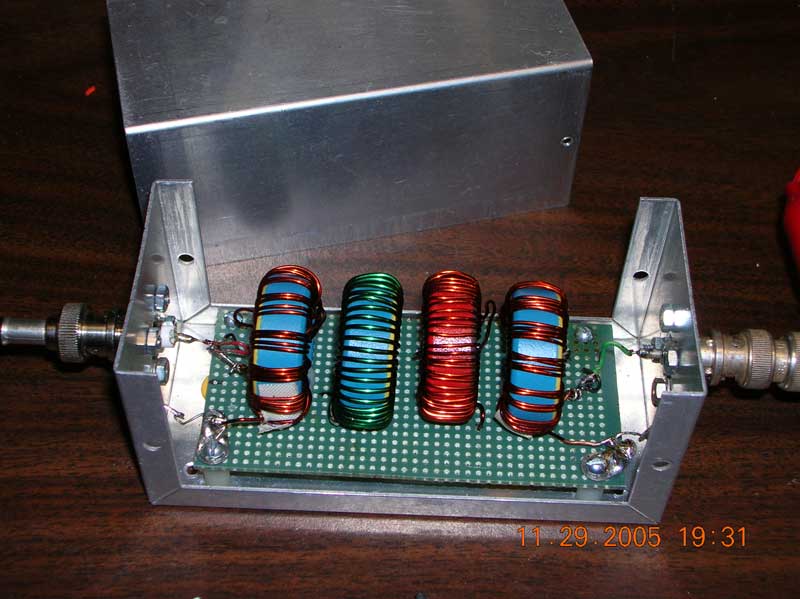
Figure 7
This figure is a closeup view of the home brew filter. The cores are iron powder cores from Micro Metals. The capacitors used in the filter are under the board. This filter is capable of handling 100 watts with a 3:1 VSWR. That specification far exceeds what is required for RX filters and a comparable filter could be built using much smaller cores and wire size than the T130 cores in the picture The wire on the cores in the picture is #18.
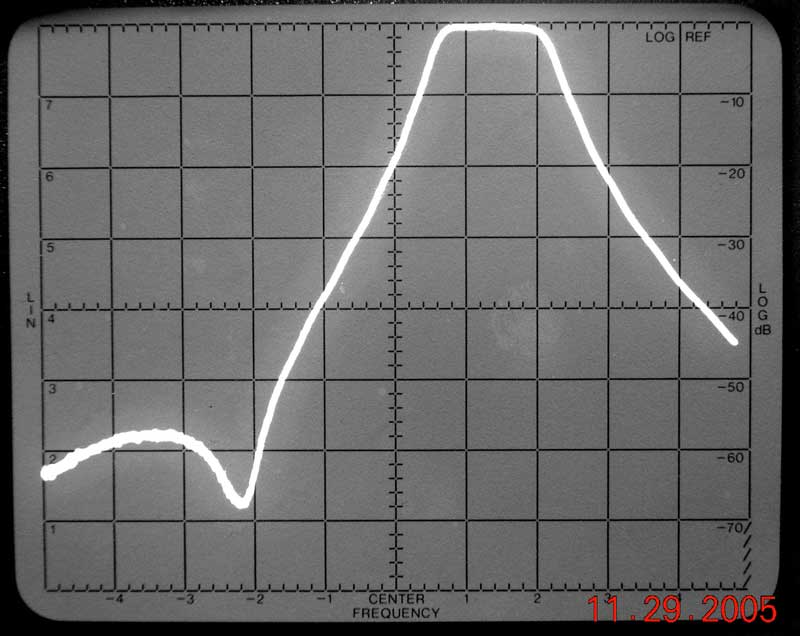
Figure 8
This figure shows the transmission curve of the filter. The center frequency is 3.0 MHz and each division is 0.5 MHz. The 3500-4000 kHz band has a very low transmission loss. The notch to the left covers 1700-2000 kHz and has a transmission loss of 60 dB or more which will reduce dramatically any 160 m signals. The BC band, 3 to 4 divisions to the left of the center line, has a transmission loss of at least 58 dB. The significance of the transmission loss is shown in the next figure.
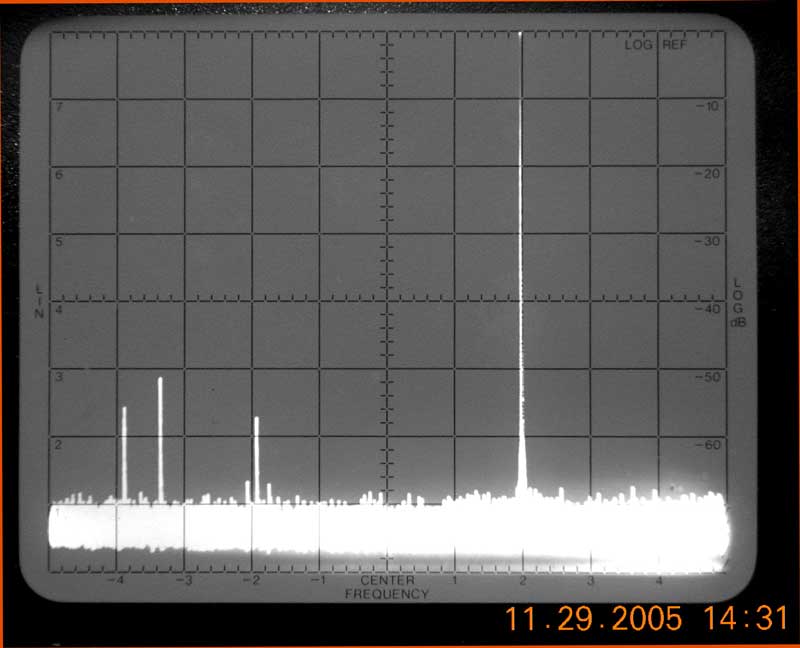
Figure 9
In this figure the top of the display is -40 dBm (approximately S9+30) . I injected a 4 MHz and a 2 MHz signal into the filter input. Both signals were -60 dBm at the filter input. The preamp added 20 dB after the filter. The result is that the 4 MHz signal is -40 dBm and touches the top of the display -- essentially no loss going through the filter. The 2 MHz signal (two divisions to the left of the center line) has been attenuated by some 58 dB from its original strength.
The two signals at 1.2 MHz and 1.6 MHz (left of the 2 MHz signal] are BC band signals that were picked up within the preamp. I ran a number of tests trying to get rid of them but they clearly were being picked up by the preamp circuitry and not coming from filter 'blow by' or common mode. To put things in perspective here, the -60 dB line on the display is -100 dBm so these signals would be able to be heard with a good receiver, but they would be quite weak.
![]()
![]()