An Example of the MFJ-1026 in operation
On January 20, 2006 I found that I had extreme noise on all bands -- 160 through 15 meters. The noise had a characteristic that led me to believe it was derived from a 60 Hz power line. As it turned out when I looked outside my house to the north at the nearest Idaho Falls subdivision I saw one street light on and all the others off. It was 10:00 AM . On closer inspection I could see that the "on" light was actually only partially on. I concluded that a ballast was bad or the daylight sensor had become intermittent. I called the Idaho Falls Power offices and explained what was wrong and they agreed to have someone come out and replace it --- in the next four days.
I decided to take my MFJ-1026 out of storage and see if it could do anything about the noise while I waited for the repair.
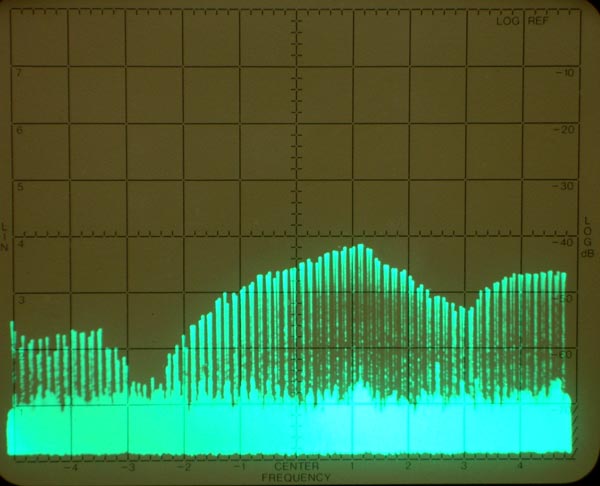
Since I have a spectrum analyzer I turned it on and looked at the 80 meter CW band. Setting the sweep time to 100 milliseconds per division I was able to capture 6 spikes per division which confirmed it was 60 Hz noise. The envelope peak of the noise spikes was over -70 dBm (about S9 on my receiver). I used my HyTower tuned to 80 meters for receiving.
Next I connected one of the loops of my two loop K9AY system to the sense antenna (AUX) input of the MFJ-1026 and the HyTower to the Main antenna input. Then I adjusted the amplitude of the sense and main antenna signals and the phase controls on the MFJ to get a null from 3500 to 3550 kHz. This was quite evident on the spectrum analyzer display and spectacularly evident on my FT1000MP.
I could switch the unit on and off and the difference in the receiver was the S-meter was a S0 with the unit on and then S9+5 dB with the unit off.
Later in the evening I tried the same test with the FT1000MP listening on 160 meters. Again, the noise was at S0 and the signals were good. I spent an hour listening to East Coast conversation on 1850 kHz. (I am in Idaho).
The pictures below show the spectrum analyzer displays from the experiment. They were made on January 20, 2006 at 11:00 AM MST.
Without the MFJ-1026

The Center Frequency is 3500 kHz. Each division is 50 kHz. The bandwidth of the scan was 3 kHz. The amplitude center line (-40 log dB) corresponds to a signal level of -60 dBm which is approximately S9+10 dB on a receiver. The base signals under the line noise are at -90 dBm and the internal noise of the analyzer is approximately the same at these settings. The sweep time per division is 100 milliseconds and there are six spikes per division which corresponds to 60 Hz generated noise. The noise blanker works reasonably well on this type of noise. The envelope of line noise spikes is quite evident.
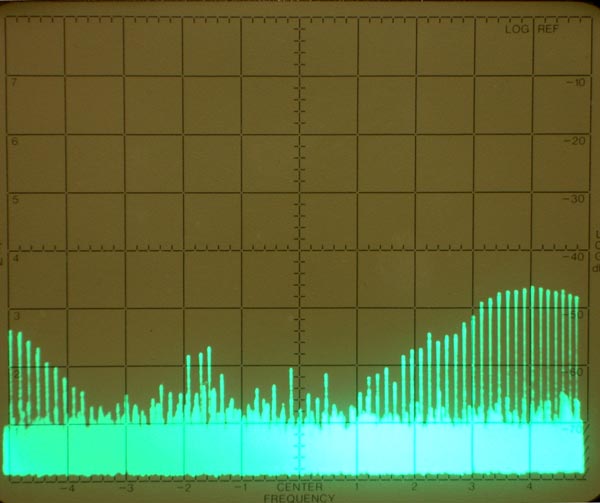
With the MFJ-1026

The Center Frequency is 3500 kHz. Each division is 50 kHz. The bandwidth of the scan was 3 kHz. The amplitude center line (-40 log dB) corresponds to a signal level of -60 dBm which is approximately S9+10 dB on a receiver. The base signals under the line noise are at -90 dBm and the internal noise of the analyzer is approximately the same at these settings. The sweep time per division is 100 milliseconds and there are six spikes per division which corresponds to 60 Hz generated noise.
In this picture the effect of the MFJ-1026 cancellation is quite evident. In particular, 3540-3550 kHz shows no spikes due to the 60 Hz noise. There were some noise bursts that I heard when the major noise was cancelled and I expect they were from other noise generators. Those noise spikes were very intermittent and just happened to be caught in the picture.
When I listened to 3540 kHz on a receiver (FT1000MP) the background noise was S0 with occasional pops. If I turned off the MFJ-1026 the noise immediately was S9+5 dB. Later in the evening I could duplicate the result on 80 and 160; the noise would drop to S0 and even very weak signals were quite readable. Without the MFJ the noise was very high although I could use the noise blanker to cut it down quite a bit. I was not able to achieve the same signal to noise ratio with the blanker as with the MFJ.
------------- Addition on January 21, 2006.
I recorded four wave file snippets (.wav) using my FT1000MP that show the effect of the MFJ-1026. In this case I happened to be listening on 75 meters for the first two. The time was 5:00 PM MST and the stations were on the East Coast [I am listening in Idaho].
In the following examples I turn the MFJ on and off so you can really hear the effect. The third audio example is on 80 CW . The time was 5:48 PM MST and I am listening to two stations on the east coast on CW. The fourth example is Japanese SSB (USB) on 3520 kHz Jan 22, 2006 at 7:00 AM MST.
I suggest the best way to listen to these sound bites is to select them, then right click on them and then pick the "save target as....." option. You can then download them to your desktop and use whatever software is your choice to play the audio.
---- end of note----
Tod Olson, K0TO