Measurements of noise floor for various antennas at my Idaho QTH
These measurements were made following the removal of a pair of very bad power line noise sources [lightning arrestors] from a nearby 12.5 kV distribution line operated by the Idaho Falls Power Company. The high voltage feeds to the arrestors were clipped about three hours prior to the start of the March 2007 ARRL SSB DX Test. The result was dramatic. So much so that I decided to use my HP 141T spectrum analyzer to look at the noise floor of the antennas at my station in Idaho near Idaho Falls.
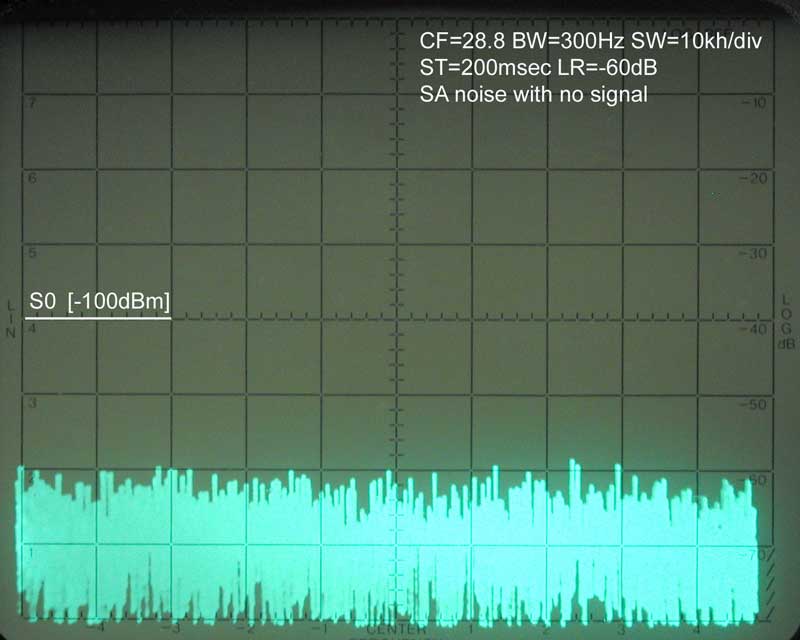
On Tuesday. March 20, 2007 at about 11 AM Mountain Daylight Time I aimed the rotary beams to 235 degrees -- ZL and VK -- which I expected to be very quiet at that time. The spectrum analyzer was set to a band width [BW] of 300 Hz [CW filter approximation] and a scan width [SW] of 10 kHz/division which provided a look at frequencies +/- 50 kHz from the center frequency [CF]. The amplifier gain [LR] was set so that the midline of the screen would be at -100dBm which is nominally the S0 reading for my FT1000MP. With these settings the noise floor of the spectrum analyzer is -120 dBm. {A good communications receiver will have a noise floor less than -125 dBm but the antenna noise is usually well above that level}. The scan time [ST] was set for 200 milliseconds/division. This meant that I would spend about 20 milliseconds looking at each kHz which would allow collection of random peaks of noise that occurred in that period.
I selected frequencies 100 kHz above the lower edge of each band as the center frequency for the scan for that band. The antenna for 20-15-10 was a TH7DXX. The beam antenna for 40m was a 40-2CD. The 80m antenna was an inverted Vee with a center at 48 feet. A scan of a 40m inverted Vee with the center at 48 feet was also made.
I was pleased to see that the scans for 10-15-20 and 40 all indicated that the noise was below S0. [That was confirmed later using the FT1000MP]. The 80m dipole scan showed some birdies, some strange noises and below 3.7 MHz what appeared to be IMD from BC stations. Overall though, the noise was very close to S0 which was a pleasant surprise after the 24 hour per day S9+ noise due to the lightning arrestors. The 40m dipole noise was significantly below S0.
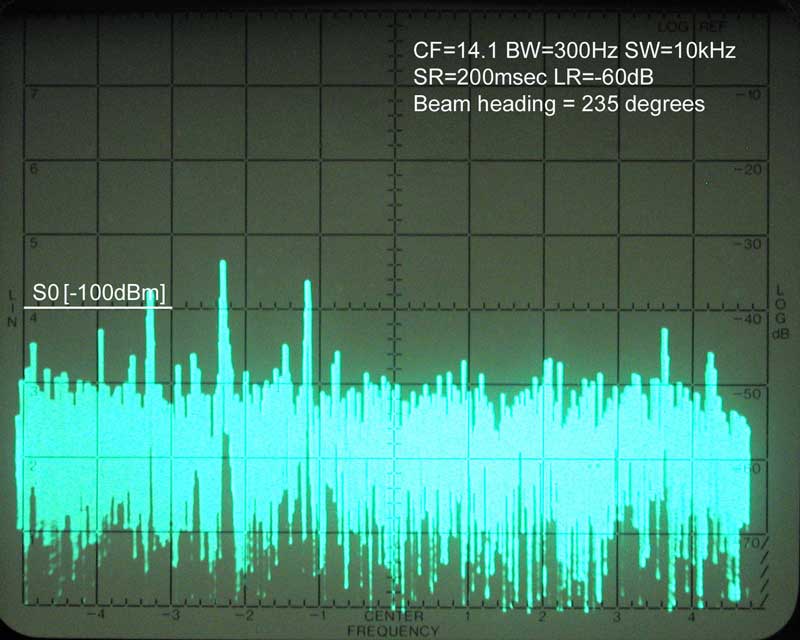
The only band that was open here in Idaho at that time was 20 meters. The scan [Figure 1] shows signals but for the most part the peaks are band noise and they are at about -110 dBm. Signals at that level could be copied but with some difficulty.
The scan for 15 meters [Figure 2] shows two significant signals, both less than -100dBm so they would not be seen on my S-meter. There are a number of other peaks around 21.2 suggestive of signals but they are closer to -115 dBm and would be quite faint. The noise is on the order of -117 dBm; above the minimum detectable signal level of the receiver by at least 10 dB.
The scan for 10 meters [Figure 3] has a strange signal or noise at 28.125 MHz which has an amplitude of -110 dBm. The noise peaks are down around -120 dBm on the average.
The scan for the 40 meter beam [Figure 4] seems to indicate that below 7.100 MHz the noise floor is lower than above 7.100 . I am not quite sure why this is. Below 7.1 MHz the floor seem to drop as low as -108 dBm; above 7.1 MHz it seems to be about -100 dBm.
The scan of the 40 meter dipole [Figure 5] shows the noise floor to be slightly less than the beam --particularly above 7.1 MHz, but there is a noticeable difference between the 50 kHz above 7.1 and below. The difference in the noise floor for the two scans may be due to the different gain of each antenna or it may be that since the dipole run N-S the orientation produces the difference. It is only 2-4 dB or so which would be difficult to hear.
The scan of the 80 meter dipole [Figure 6] shows a noise floor slightly above -100 dBm. There are also a number of strange noises that appear on the scan but they are transient except for the noise signal at 3678 which is some mixture of BC band signals.
These scans really show conditions for CW operation and the situation for Phone operations would not be as good. It is my intention to make a similar set of scans for a bandwidth of 3 kHz to get an idea what one might expect for that kind of operation.
Comments are always appreciated. Send them to tod@k0to.us
The spectrum analyzer scans are below:
Figure 1 below.
Figure 2 below.
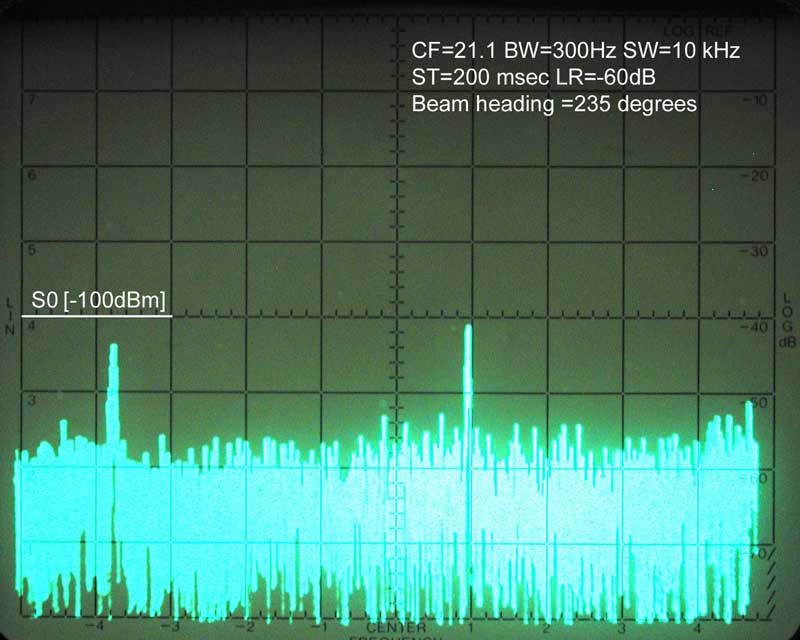
Figure 3 below.
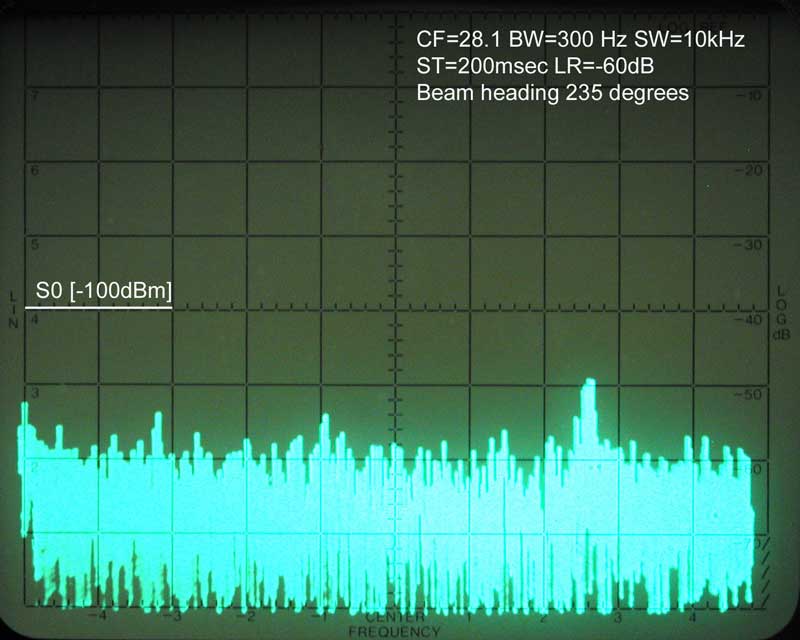
Figure 4 below
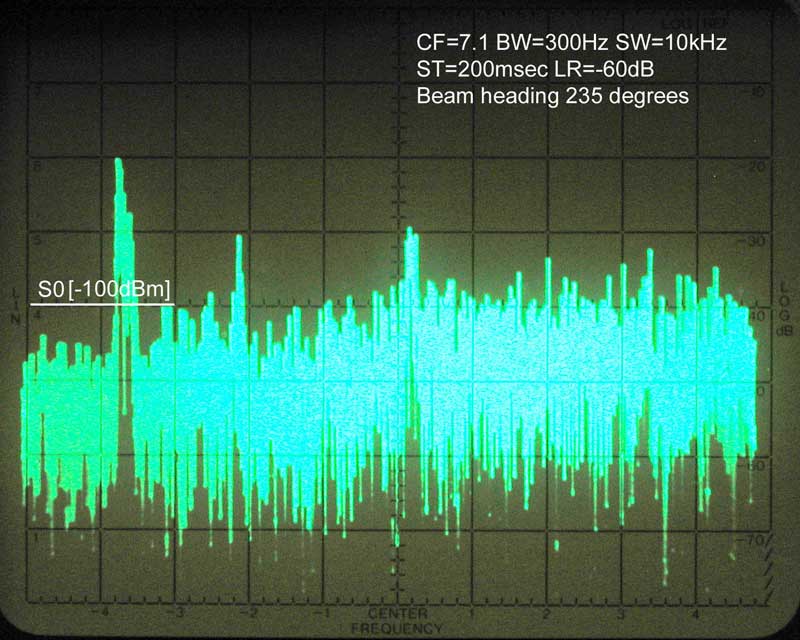
Figure 5 below
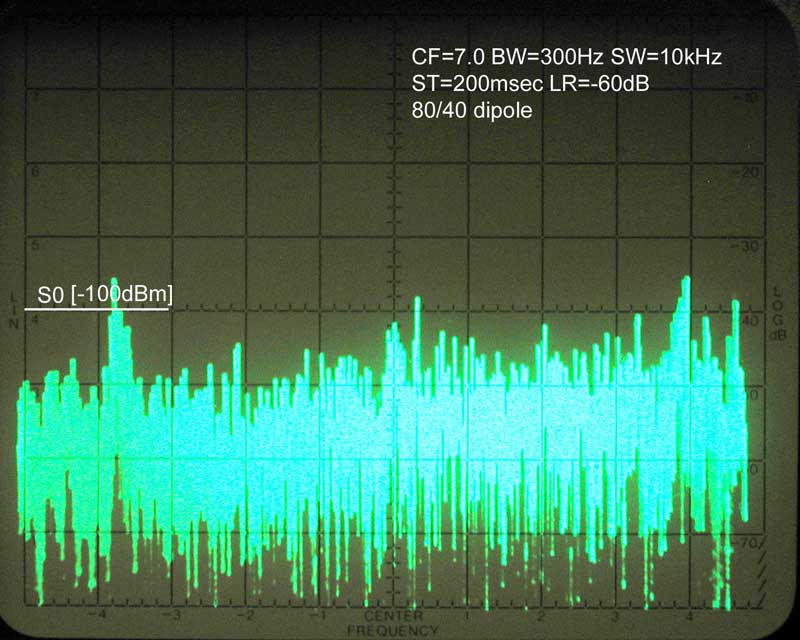
Figure 6 below
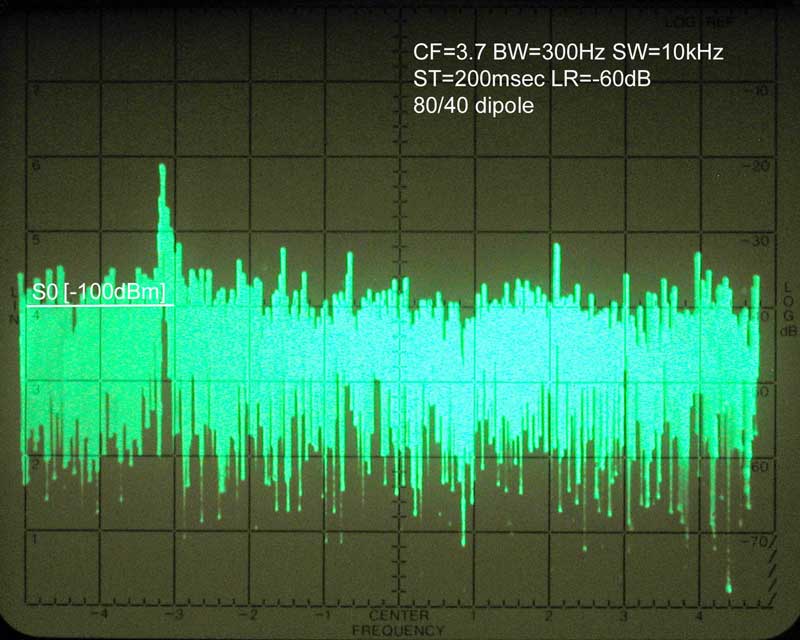
Figure 7 below